Ongoing power problems with Oncor
For the last 7 weeks, my entire home has had power fluctuations that were really frustrating. Initially I noticed lights flickering in the bathrooms and kitchen. But it got worse, much worse.
My reef uses the Apex controller, which comes with the Eb832 energy bars. Normally we use them to turn things on and off that are plugged into them. They measure power consumption and can tell you if a pump is using too much or too little energy. However, they do something else: they measuring the incoming voltage. I was looking at those numbers specifically 18 months ago during our ice storm that knocked out power to 20 million people in Texas. My system was running on a generator, but the power wasn't coming out cleanly and the Voltage reading were concerning. But I digress.
When I was vacuuming my home, which takes about 20 minutes, I couldn't help but notice that the motor was at one speed, then slowed down for 10 seconds, then sped up again. That's weird. Another occasion I was using a Waterpik and heard that device slow down and ramp up. My iMac's screen would go dim, then brighten, but I wasn't touching the brightness buttons.
I called the electric company to have them check the incoming power. They removed the meter, and hooked up two different devices to measure the voltage as well as the amperage. Of course everything was "normal" during the 10 minutes of testing. My power issues happen whenever, sporadically. There was no way to align it with anything. One night I turned off the breaker that feeds power to the Studio, in case that was it but it didn't make a difference.
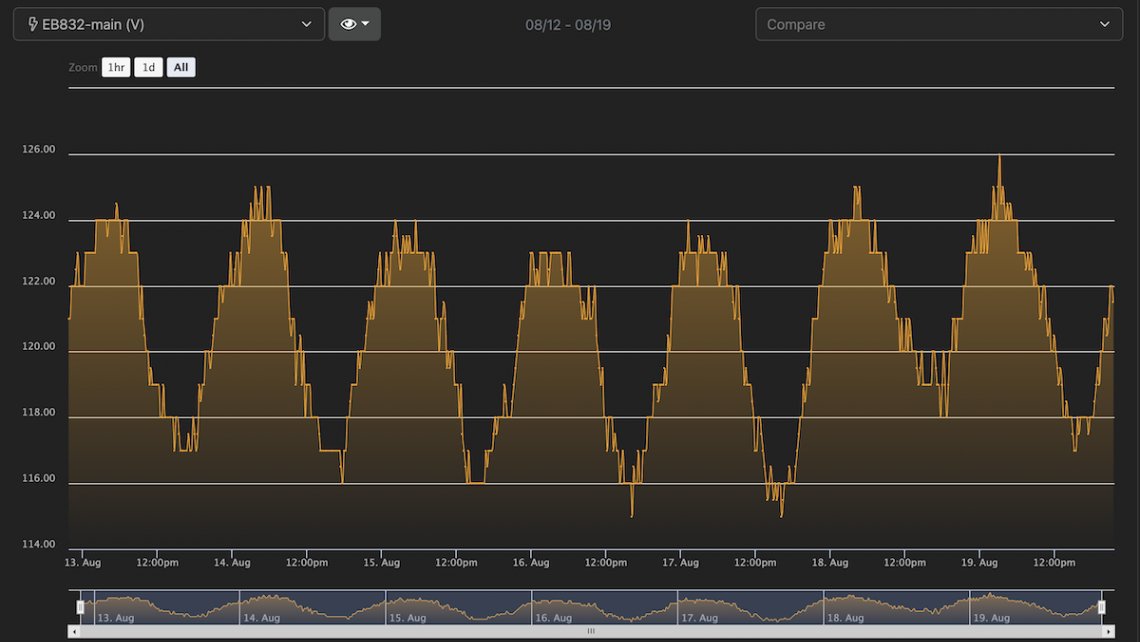
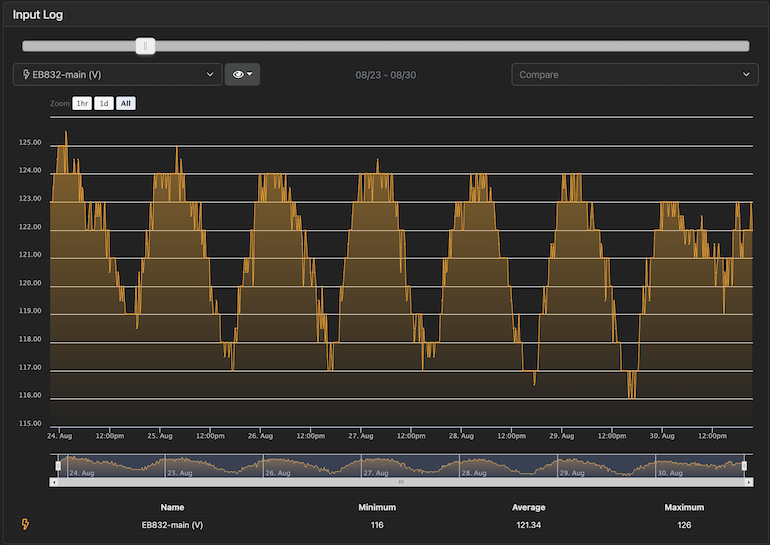
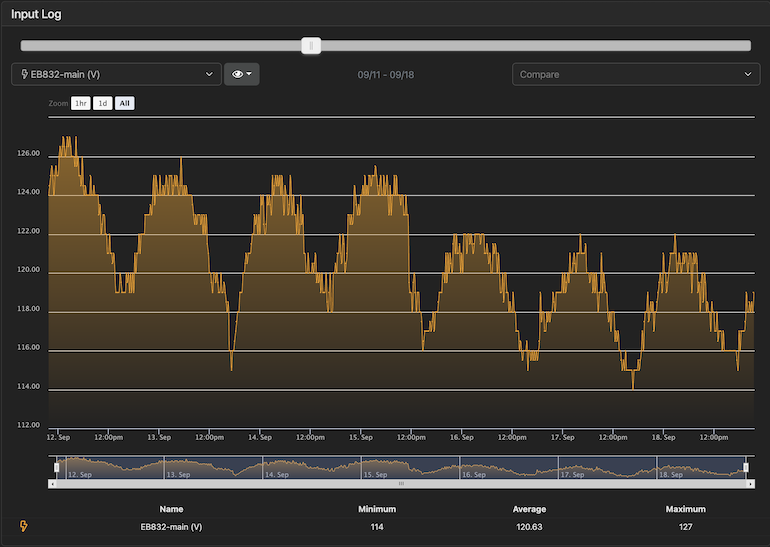
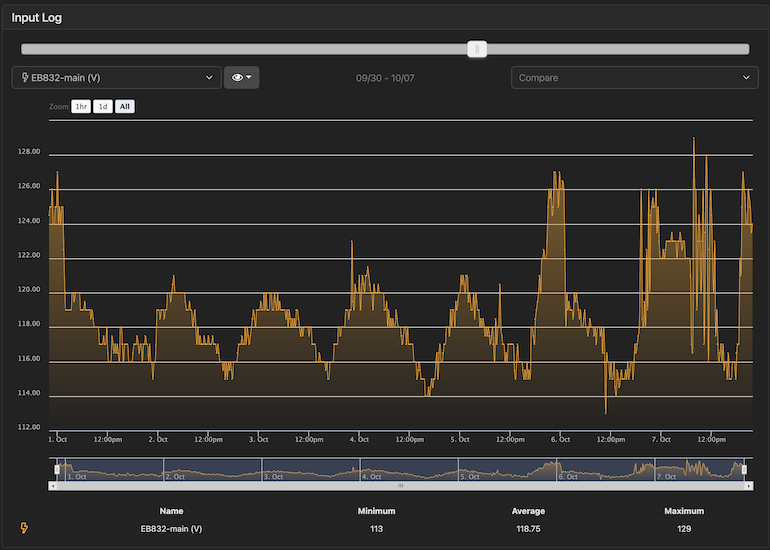
That's when I checked my Apex to see what it was reading. Each screenshot shows the low reading, the high reading, and the average number. At the top you can see the dates. Apex Fusion keeps track of 12 weeks of data, so I was able to look at what the voltage measured back in August. Week by week, I could scroll through the graphs, studying the highs and lows. The week of August 12-19, the power graph looks normal, but you will see how it changes for the worse image by image.
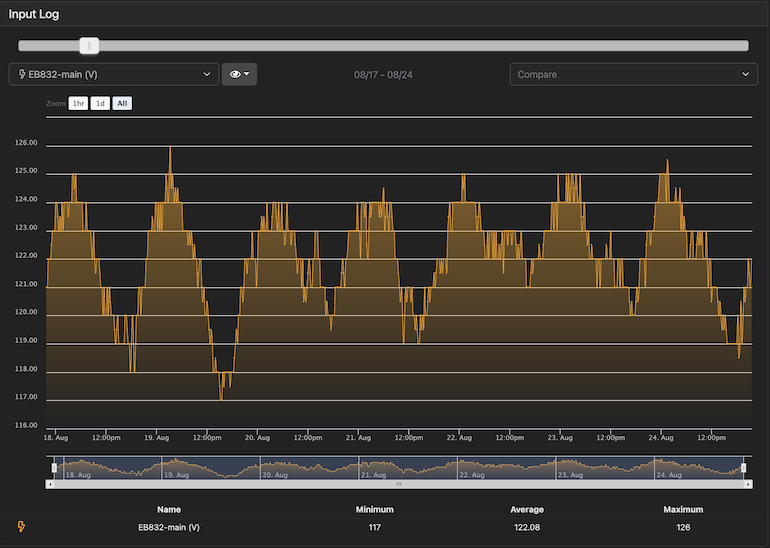
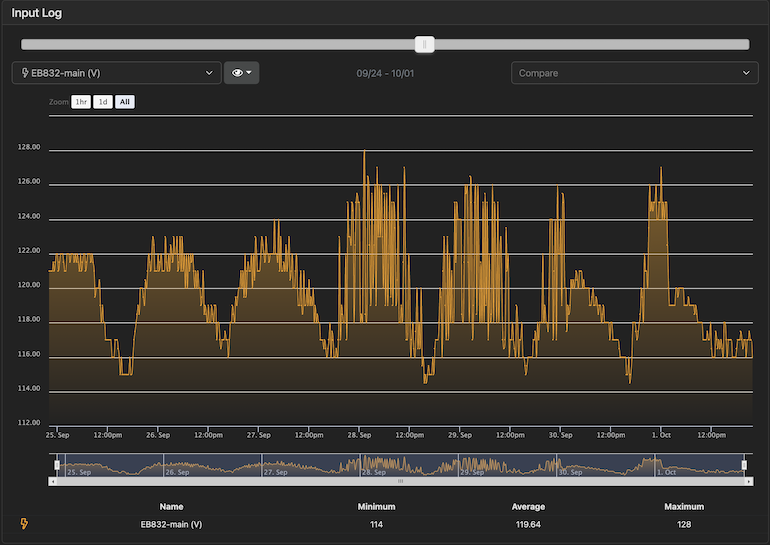
I own two Eb832 energy bars on two different circuits that had matching voltage readings. I also have the Hydros controller on another tank on yet another circuit, which reports voltage too. It doesn't graph it like the Apex, but when I opened up the app, I could see the current value, which then matched what I would see in Fusion at the same time.
I called the power company a second time to come inspect the power. I really wanted them to hook up a device that tracks and records data of the power entering at the meter, but they don't offer that. Would you believe the Smart Meters do NOT track the power flow? They only act like an odometer, measuring what we use, nothing more. That seems unfortunate to me. Wouldn't it be great if they could activate that feature when the need arises, to help identify potential issues?
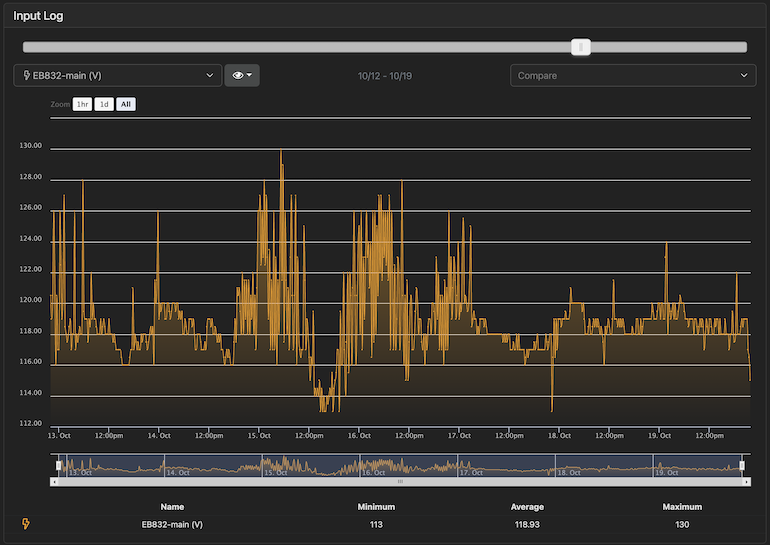
Like the first time, the lineman said everything was normal. He replaced the connections where the power connects to the house, but that made no difference. Power fluctuated from 106V to 134V within the hour.
I was wondering if I needed to replace my entire breaker panel to solve the problem. But if I hired an electrician and spent upwards of $2000 "fixing it" only to find everything was still flickering because the problem was actually from the power company, I'd be really upset (as would anyone else). I don't mind paying to fix a problem, provided it's my responsibility and the correct solution.
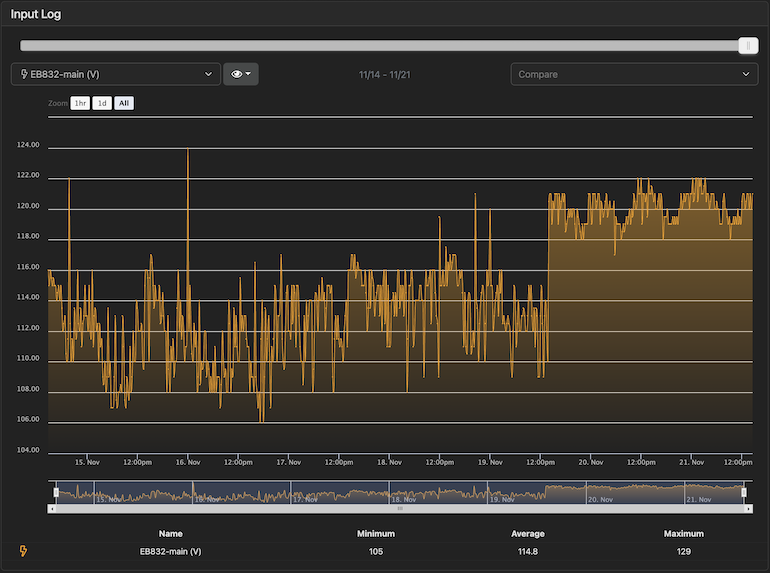
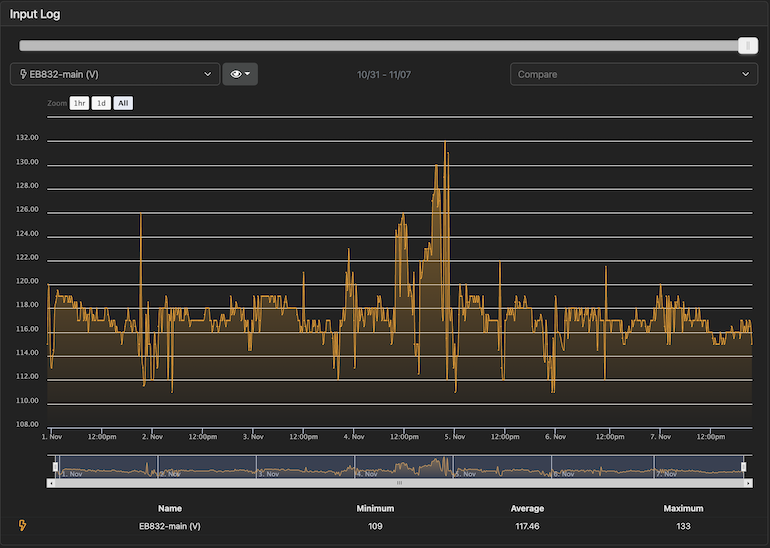
The lowest number yet, 105 volts was recorded. But as of Saturday afternoon, the graph indicated a big change. That was promising.
Here's a closeup of 24 hours:
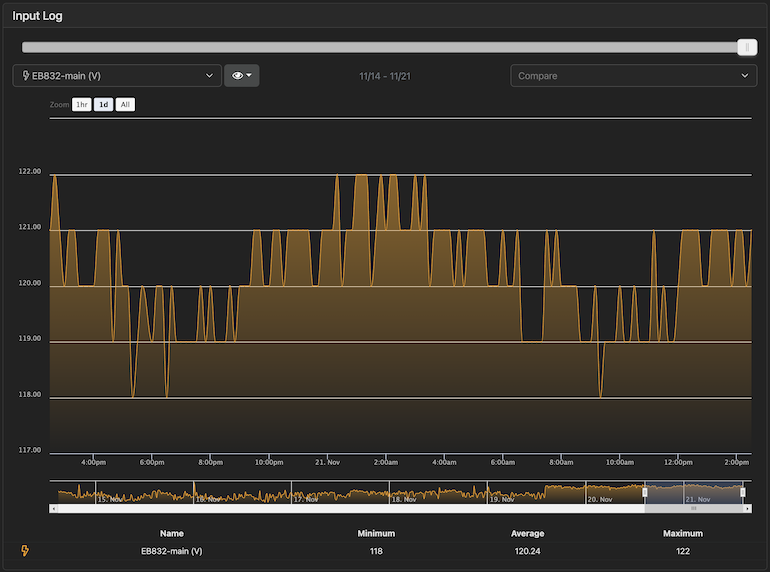
Clearly, my home's breaker box was NOT the problem at all, nor any of its components. Nor the addition of the Studio. As I figured all along, this was a problem somewhere in my neighborhood that needed to be mended.
I've put in a call with the power company to find out exactly what they fixed. I've had to live with these circumstances for seven weeks, two service calls, plus a few things were damaged during that time. About 1/3 of the outdoor LED string lights blew out (22 out of 72), and a 12V power supply for the Apex took a hit. I'm sure if this situation had continued, more gear would have been damaged or their longevity reduced.
Thankfully this problem appears to be gone. Hopefully never to return.